

Greetings dRPC Community!
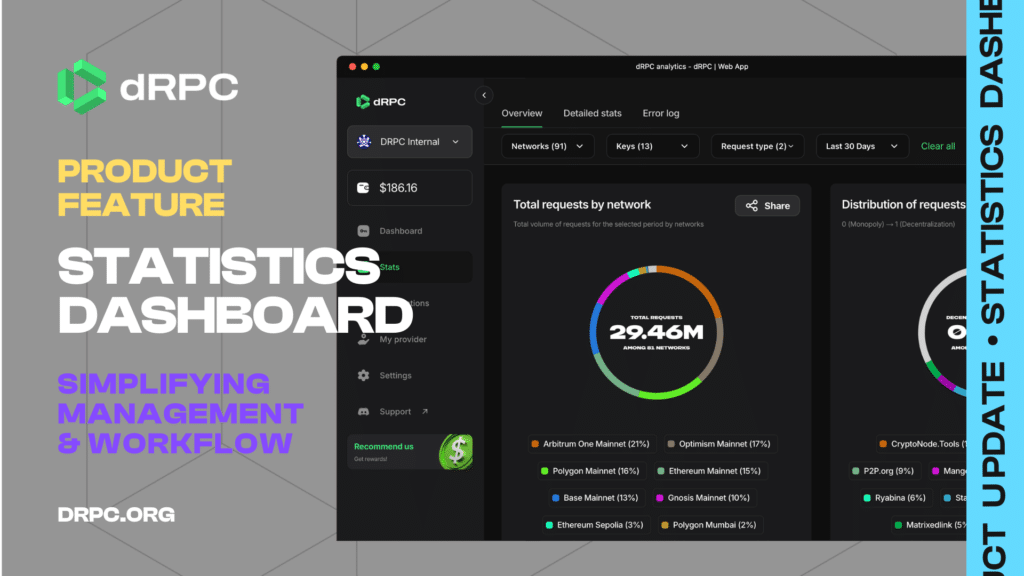
Exciting news – we’ve upgraded our RPC statistics dashboard to a more user-friendly version, consolidating all your operations into a unified dashboard. This integration means there’s no longer a need to juggle between different providers, streamlining both management and your overall workflow.
Enhanced Filters
dRPC’s statistic dashboard filters have undergone a transformation to enhance intuitiveness, particularly with the time period selection, enabling you to effortlessly choose any duration from a single day to your entire activity lifespan.
Overview Tab Highlights
Total Requests by Network
Easily monitor the aggregate number of requests throughout your chosen timeline, alongside the total networks involved and their respective contributions.
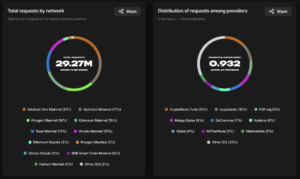
Request Distribution Among Providers
Unveil and assess your decentralization score, illustrating how our AI-driven load balancer spreads requests across different providers.
(check previous screenshot)
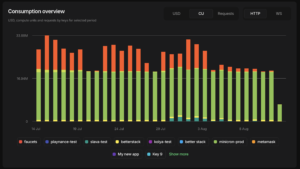
Consumption Overview
In the dRPC statistics dashboard, you can monitor resource consumption across various metrics like compute units (CU), request counts, and financial expenditure ($), detailed by API key.
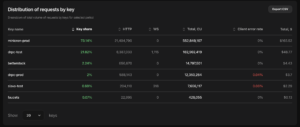
Request Distribution by Key
Obtain and download comprehensive data for each API key, covering details like usage proportion, number of HTTP/WS requests, CU consumed, client error percentage, and total costs in $.
Detailed Stats Tab
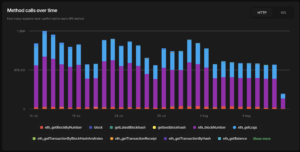
Explore in-depth request activity and latency analytics. This section will enlighten you on request types and performance, facilitating efficient usage optimization and swift problem resolution.
Error Log Tab
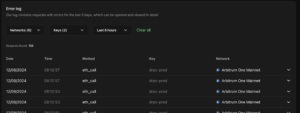
Last, on our RPC statistics dashboard, you can efficiently log and scrutinize all client-side errors, enabling faster identification and rectification of issues to enhance operational smoothness and reliability.
Do you have any suggestions?
We value your input incredibly, and we encourage you to contact us with suggestions or ideas for further enhancements.
Warmest regards, The dRPC Team 🚀
